My algorithm watches stocks from the S&P500 index, searching for breakout scenarios. It calculates the expectation of the Base Strategy outcome, comparing the case with other similar cases, using the last 4 years of daily bars for all S&P500 stocks (about 5 000 breakout cases).
Disclaimer: This data is not investment advice. You may lose money trading stocks.
Current Breakout Setups:
Last update UTC time: 2022-04-12 00:44:55

V
Score +28
Warn 57%
Take: 258.98
Enter: 235.86
Stop: 186.66
Enter: 235.86
Stop: 186.66
Case: 8-L
Scale: 26%
Shares: 20
Scale: 26%
Shares: 20

SLB
Score +27
Warn 43%
Take: 44.36
Enter: 42.88
Stop: 39.73
Enter: 42.88
Stop: 39.73
Case: 3-F
Scale: 8%
Shares: 317
Scale: 8%
Shares: 317

MKC
Score +24
Warn 59%
Take: 113.39
Enter: 107.36
Stop: 94.54
Enter: 107.36
Stop: 94.54
Case: 2-L
Scale: 14%
Shares: 78
Scale: 14%
Shares: 78

TAP
Score +23
Warn 63%
Take: 56.77
Enter: 54.53
Stop: 49.76
Enter: 54.53
Stop: 49.76
Case: 4-F
Scale: 10%
Shares: 209
Scale: 10%
Shares: 209

NWS
Score +23
Warn 30%
Take: 25.98
Enter: 24.17
Stop: 20.32
Enter: 24.17
Stop: 20.32
Case: 8-L
Scale: 19%
Shares: 259
Scale: 19%
Shares: 259

NLOK
Score +23
Warn 25%
Take: 31.23
Enter: 29.36
Stop: 25.38
Enter: 29.36
Stop: 25.38
Case: 3-F
Scale: 16%
Shares: 251
Scale: 16%
Shares: 251

SYF
Score +22
Warn 50%
Take: 40.02
Enter: 38.30
Stop: 34.65
Enter: 38.30
Stop: 34.65
Case: 4-F
Scale: 11%
Shares: 273
Scale: 11%
Shares: 273

NLOK
Score +21
Warn 25%
Take: 32.63
Enter: 30.31
Stop: 25.38
Enter: 30.31
Stop: 25.38
Case: 3-L
Scale: 19%
Shares: 202
Scale: 19%
Shares: 202

NWL
Score +21
Warn 23%
Take: 29.09
Enter: 26.46
Stop: 20.87
Enter: 26.46
Stop: 20.87
Case: 1-L
Scale: 27%
Shares: 178
Scale: 27%
Shares: 178

NWSA
Score +21
Warn 29%
Take: 25.48
Enter: 23.74
Stop: 20.04
Enter: 23.74
Stop: 20.04
Case: 8-L
Scale: 18%
Shares: 270
Scale: 18%
Shares: 270

OMC
Score +21
Warn 27%
Take: 100.28
Enter: 91.62
Stop: 73.19
Enter: 91.62
Stop: 73.19
Case: 2-L
Scale: 25%
Shares: 54
Scale: 25%
Shares: 54

VZ
Score +20
Warn 68%
Take: 57.57
Enter: 55.40
Stop: 50.79
Enter: 55.40
Stop: 50.79
Case: 8-L
Scale: 9%
Shares: 216
Scale: 9%
Shares: 216

IPG
Score +19
Warn 28%
Take: 43.83
Enter: 39.99
Stop: 31.82
Enter: 39.99
Stop: 31.82
Case: 8-L
Scale: 26%
Shares: 122
Scale: 26%
Shares: 122

PPL
Score +19
Warn 66%
Take: 33.43
Enter: 30.82
Stop: 25.26
Enter: 30.82
Stop: 25.26
Case: 1-L
Scale: 22%
Shares: 179
Scale: 22%
Shares: 179

CTSH
Score +19
Warn 21%
Take: 97.21
Enter: 93.48
Stop: 85.54
Enter: 93.48
Stop: 85.54
Case: 2-L
Scale: 9%
Shares: 125
Scale: 9%
Shares: 125

KSS
Score +18
Warn 47%
Take: 70.70
Enter: 64.39
Stop: 50.96
Enter: 64.39
Stop: 50.96
Case: 2-L
Scale: 26%
Shares: 74
Scale: 26%
Shares: 74

HII
Score +17
Warn 40%
Take: 246.96
Enter: 228.67
Stop: 189.75
Enter: 228.67
Stop: 189.75
Case: 2-L
Scale: 21%
Shares: 25
Scale: 21%
Shares: 25

SYF
Score +17
Warn 50%
Take: 40.16
Enter: 38.40
Stop: 34.65
Enter: 38.40
Stop: 34.65
Case: 4-L
Scale: 11%
Shares: 266
Scale: 11%
Shares: 266

SNA
Score +16
Warn 48%
Take: 237.33
Enter: 224.67
Stop: 197.74
Enter: 224.67
Stop: 197.74
Case: 7-L
Scale: 14%
Shares: 37
Scale: 14%
Shares: 37

ES
Score +16
Warn 76%
Take: 104.38
Enter: 95.51
Stop: 76.63
Enter: 95.51
Stop: 76.63
Case: 4-F
Scale: 25%
Shares: 52
Scale: 25%
Shares: 52

PM
Score +16
Warn 53%
Take: 123.83
Enter: 112.49
Stop: 88.36
Enter: 112.49
Stop: 88.36
Case: 2-L
Scale: 27%
Shares: 41
Scale: 27%
Shares: 41

IBM
Score +16
Warn 32%
Take: 153.21
Enter: 142.21
Stop: 118.80
Enter: 142.21
Stop: 118.80
Case: 1-L
Scale: 20%
Shares: 42
Scale: 20%
Shares: 42

K
Score +15
Warn 69%
Take: 80.55
Enter: 72.89
Stop: 56.60
Enter: 72.89
Stop: 56.60
Case: 6-L
Scale: 29%
Shares: 61
Scale: 29%
Shares: 61

TDG
Score +15
Warn 61%
Take: 748.75
Enter: 686.07
Stop: 552.71
Enter: 686.07
Stop: 552.71
Case: 8-L
Scale: 24%
Shares: 7
Scale: 24%
Shares: 7

RF
Score +15
Warn 21%
Take: 26.72
Enter: 24.56
Stop: 19.96
Enter: 24.56
Stop: 19.96
Case: 8-F
Scale: 23%
Shares: 217
Scale: 23%
Shares: 217

GE
Score +14
Warn 24%
Take: 107.61
Enter: 100.47
Stop: 85.28
Enter: 100.47
Stop: 85.28
Case: 7-F
Scale: 18%
Shares: 65
Scale: 18%
Shares: 65

ZION
Score +14
Warn 24%
Take: 75.61
Enter: 71.26
Stop: 62.00
Enter: 71.26
Stop: 62.00
Case: 5-L
Scale: 15%
Shares: 107
Scale: 15%
Shares: 107

LNC
Score +14
Warn 31%
Take: 75.08
Enter: 69.64
Stop: 58.06
Enter: 69.64
Stop: 58.06
Case: 8-F
Scale: 20%
Shares: 86
Scale: 20%
Shares: 86

TAP
Score +14
Warn 63%
Take: 56.98
Enter: 54.67
Stop: 49.76
Enter: 54.67
Stop: 49.76
Case: 4-L
Scale: 10%
Shares: 203
Scale: 10%
Shares: 203

SIVB
Score +14
Warn 27%
Take: 645.18
Enter: 594.52
Stop: 486.73
Enter: 594.52
Stop: 486.73
Case: 7-F
Scale: 22%
Shares: 9
Scale: 22%
Shares: 9

LKQ
Score +14
Warn 51%
Take: 49.49
Enter: 47.53
Stop: 43.36
Enter: 47.53
Stop: 43.36
Case: 5-L
Scale: 10%
Shares: 239
Scale: 10%
Shares: 239

MTD
Score +14
Warn 28%
Take: 1508.27
Enter: 1444.81
Stop: 1309.79
Enter: 1444.81
Stop: 1309.79
Case: 4-L
Scale: 10%
Shares: 7
Scale: 10%
Shares: 7

GE
Score +14
Warn 24%
Take: 112.42
Enter: 103.74
Stop: 85.28
Enter: 103.74
Stop: 85.28
Case: 7-L
Scale: 22%
Shares: 54
Scale: 22%
Shares: 54

DPZ
Score +13
Warn 24%
Take: 433.52
Enter: 415.91
Stop: 378.45
Enter: 415.91
Stop: 378.45
Case: 7-F
Scale: 10%
Shares: 26
Scale: 10%
Shares: 26

K
Score +13
Warn 92%
Take: 72.88
Enter: 68.61
Stop: 59.53
Enter: 68.61
Stop: 59.53
Case: 1-L
Scale: 15%
Shares: 110
Scale: 15%
Shares: 110

XRX
Score +13
Warn 33%
Take: 22.12
Enter: 21.00
Stop: 18.62
Enter: 21.00
Stop: 18.62
Case: 5-L
Scale: 13%
Shares: 420
Scale: 13%
Shares: 420

SNA
Score +13
Warn 49%
Take: 237.00
Enter: 224.45
Stop: 197.74
Enter: 224.45
Stop: 197.74
Case: 8-L
Scale: 14%
Shares: 37
Scale: 14%
Shares: 37

LH
Score +13
Warn 44%
Take: 300.67
Enter: 287.25
Stop: 258.70
Enter: 287.25
Stop: 258.70
Case: 7-F
Scale: 11%
Shares: 35
Scale: 11%
Shares: 35
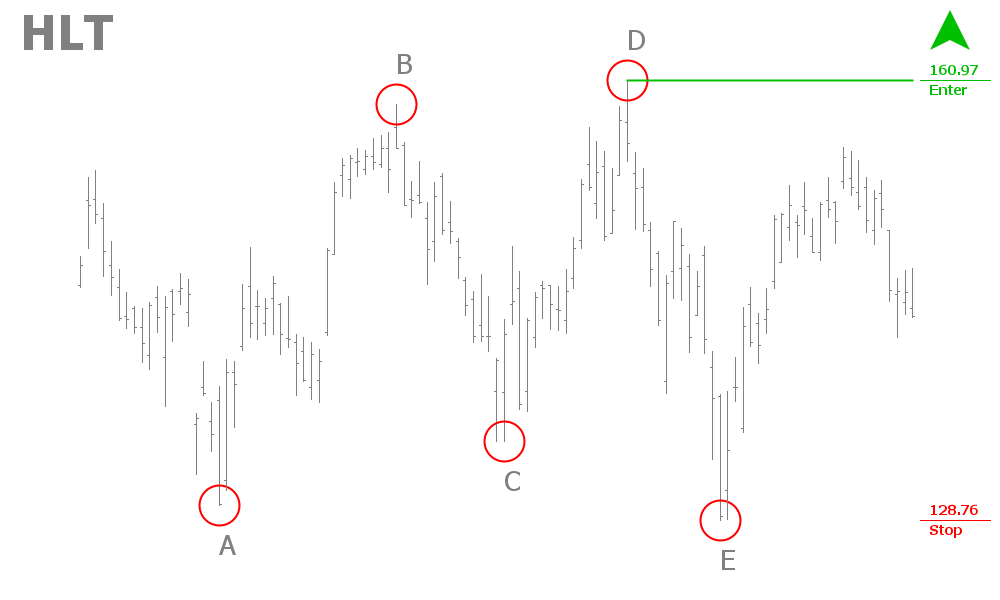
HLT
Score +13
Warn 46%
Take: 176.11
Enter: 160.97
Stop: 128.76
Enter: 160.97
Stop: 128.76
Case: 8-L
Scale: 25%
Shares: 31
Scale: 25%
Shares: 31

IT
Score +12
Warn 59%
Take: 336.11
Enter: 310.97
Stop: 257.49
Enter: 310.97
Stop: 257.49
Case: 8-L
Scale: 21%
Shares: 18
Scale: 21%
Shares: 18

CAG
Score +12
Warn 53%
Take: 43.72
Enter: 39.35
Stop: 30.05
Enter: 39.35
Stop: 30.05
Case: 2-L
Scale: 31%
Shares: 107
Scale: 31%
Shares: 107

SLG
Score +12
Warn 42%
Take: 92.89
Enter: 85.04
Stop: 68.33
Enter: 85.04
Stop: 68.33
Case: 3-F
Scale: 24%
Shares: 59
Scale: 24%
Shares: 59

CL
Score +12
Warn 61%
Take: 90.37
Enter: 84.56
Stop: 72.19
Enter: 84.56
Stop: 72.19
Case: 8-F
Scale: 17%
Shares: 80
Scale: 17%
Shares: 80

SLB
Score +12
Warn 40%
Take: 45.61
Enter: 43.73
Stop: 39.73
Enter: 43.73
Stop: 39.73
Case: 1-L
Scale: 10%
Shares: 250
Scale: 10%
Shares: 250

VZ
Score +11
Warn 34%
Take: 67.73
Enter: 61.96
Stop: 49.68
Enter: 61.96
Stop: 49.68
Case: 5-L
Scale: 25%
Shares: 81
Scale: 25%
Shares: 81

BSX
Score +11
Warn 76%
Take: 47.46
Enter: 45.33
Stop: 40.79
Enter: 45.33
Stop: 40.79
Case: 4-L
Scale: 11%
Shares: 220
Scale: 11%
Shares: 220

SNA
Score +11
Warn 48%
Take: 232.81
Enter: 221.60
Stop: 197.74
Enter: 221.60
Stop: 197.74
Case: 7-F
Scale: 12%
Shares: 41
Scale: 12%
Shares: 41

BDX
Score +11
Warn 87%
Take: 308.06
Enter: 278.03
Stop: 214.14
Enter: 278.03
Stop: 214.14
Case: 4-L
Scale: 30%
Shares: 15
Scale: 30%
Shares: 15

FISV
Score +11
Warn 51%
Take: 117.84
Enter: 108.91
Stop: 89.90
Enter: 108.91
Stop: 89.90
Case: 7-F
Scale: 21%
Shares: 52
Scale: 21%
Shares: 52

IPG
Score +11
Warn 28%
Take: 40.13
Enter: 37.47
Stop: 31.82
Enter: 37.47
Stop: 31.82
Case: 8-F
Scale: 18%
Shares: 176
Scale: 18%
Shares: 176

HCA
Score +11
Warn 54%
Take: 286.55
Enter: 272.27
Stop: 241.89
Enter: 272.27
Stop: 241.89
Case: 6-L
Scale: 13%
Shares: 32
Scale: 13%
Shares: 32

ES
Score +11
Warn 76%
Take: 106.09
Enter: 96.67
Stop: 76.63
Enter: 96.67
Stop: 76.63
Case: 4-L
Scale: 26%
Shares: 49
Scale: 26%
Shares: 49

CHRW
Score +10
Warn 63%
Take: 124.19
Enter: 112.16
Stop: 86.56
Enter: 112.16
Stop: 86.56
Case: 2-L
Scale: 30%
Shares: 39
Scale: 30%
Shares: 39

DFS
Score +10
Warn 39%
Take: 121.64
Enter: 117.07
Stop: 107.34
Enter: 117.07
Stop: 107.34
Case: 5-L
Scale: 9%
Shares: 102
Scale: 9%
Shares: 102

SLG
Score +10
Warn 42%
Take: 93.11
Enter: 85.19
Stop: 68.33
Enter: 85.19
Stop: 68.33
Case: 3-L
Scale: 25%
Shares: 59
Scale: 25%
Shares: 59

FISV
Score +10
Warn 51%
Take: 120.92
Enter: 111.00
Stop: 89.90
Enter: 111.00
Stop: 89.90
Case: 7-L
Scale: 23%
Shares: 47
Scale: 23%
Shares: 47

WU
Score +10
Warn 57%
Take: 21.93
Enter: 20.41
Stop: 17.17
Enter: 20.41
Stop: 17.17
Case: 5-L
Scale: 19%
Shares: 308
Scale: 19%
Shares: 308

SNA
Score +10
Warn 49%
Take: 228.33
Enter: 218.55
Stop: 197.74
Enter: 218.55
Stop: 197.74
Case: 8-F
Scale: 11%
Shares: 48
Scale: 11%
Shares: 48

WFC
Score +10
Warn 36%
Take: 57.80
Enter: 54.21
Stop: 46.57
Enter: 54.21
Stop: 46.57
Case: 1-L
Scale: 16%
Shares: 130
Scale: 16%
Shares: 130

BF-B
Score +10
Warn 76%
Take: 74.09
Enter: 70.33
Stop: 62.32
Enter: 70.33
Stop: 62.32
Case: 8-L
Scale: 13%
Shares: 124
Scale: 13%
Shares: 124

BLL
Score +10
Warn 28%
Take: 104.51
Enter: 98.00
Stop: 84.14
Enter: 98.00
Stop: 84.14
Case: 6-L
Scale: 16%
Shares: 72
Scale: 16%
Shares: 72
Table explanations:
- “Stock”: Stock ticker in NYSE or NASDAQ.
- “Case”: a scenario number, see the breakout scenarios page.
- “Warn”: how close is the price to breakout point.
- “Score”: expectation score, the average outcome of similar cases, percents of a stop size.
- “Enter”, “Stop”, “Take”: prices of correspondent orders in the Base Strategy order bracket.
- “Scale”: a stop size in percents. It’s good to know if you want to normalize the risk taken in every trade.
- “Shares”: the number of shares to buy if you want to risk $1000 a trade.
About me:
My name is Alexander Kurguzkin, I’m a market researcher and algorithmic trader since 2002. Author of the book “The Labyrinth of Illusions: Chasing success in financial markets”.
LinkedIn: https://www.linkedin.com/in/kurguzkin/
Twitter: https://twitter.com/mehanizator
If you prefer plain text format
Last update UTC time: 2022-04-12 00:44:51

| Stock | Scen | Warn | Score |  Enter  |   Stop  |   Take  |  Scale | Shares |
-------------------------------------------------------------------------------
|     V |  8-L |  57% |   +28 |  235.86 |  186.66 |  258.98 |  26.4% |     20 |
|   SLB |  3-F |  43% |   +27 |   42.88 |   39.73 |   44.36 |   7.9% |    317 |
|   MKC |  2-L |  59% |   +24 |  107.36 |   94.54 |  113.39 |  13.6% |     78 |
|   TAP |  4-F |  63% |   +23 |   54.53 |   49.76 |   56.77 |   9.6% |    209 |
|   NWS |  8-L |  30% |   +23 |   24.17 |   20.32 |   25.98 |  18.9% |    259 |
|  NLOK |  3-F |  25% |   +23 |   29.36 |   25.38 |   31.23 |  15.7% |    251 |
|   SYF |  4-F |  50% |   +22 |   38.30 |   34.65 |   40.02 |  10.5% |    273 |
|  NLOK |  3-L |  25% |   +21 |   30.31 |   25.38 |   32.63 |  19.4% |    202 |
|   NWL |  1-L |  23% |   +21 |   26.46 |   20.87 |   29.09 |  26.8% |    178 |
|  NWSA |  8-L |  29% |   +21 |   23.74 |   20.04 |   25.48 |  18.5% |    270 |
|   OMC |  2-L |  27% |   +21 |   91.62 |   73.19 |  100.28 |  25.2% |     54 |
|    VZ |  8-L |  68% |   +20 |   55.40 |   50.79 |   57.57 |   9.1% |    216 |
|   IPG |  8-L |  28% |   +19 |   39.99 |   31.82 |   43.83 |  25.7% |    122 |
|   PPL |  1-L |  66% |   +19 |   30.82 |   25.26 |   33.43 |  22.0% |    179 |
|  CTSH |  2-L |  21% |   +19 |   93.48 |   85.54 |   97.21 |   9.3% |    125 |
|   KSS |  2-L |  47% |   +18 |   64.39 |   50.96 |   70.70 |  26.4% |     74 |
|   HII |  2-L |  40% |   +17 |  228.67 |  189.75 |  246.96 |  20.5% |     25 |
|   SYF |  4-L |  50% |   +17 |   38.40 |   34.65 |   40.16 |  10.8% |    266 |
|   SNA |  7-L |  48% |   +16 |  224.67 |  197.74 |  237.33 |  13.6% |     37 |
|    ES |  4-F |  76% |   +16 |   95.51 |   76.63 |  104.38 |  24.6% |     52 |
|    PM |  2-L |  53% |   +16 |  112.49 |   88.36 |  123.83 |  27.3% |     41 |
|   IBM |  1-L |  32% |   +16 |  142.21 |  118.80 |  153.21 |  19.7% |     42 |
|     K |  6-L |  69% |   +15 |   72.89 |   56.60 |   80.55 |  28.8% |     61 |
|   TDG |  8-L |  61% |   +15 |  686.07 |  552.71 |  748.75 |  24.1% |      7 |
|    RF |  8-F |  21% |   +15 |   24.56 |   19.96 |   26.72 |  23.0% |    217 |
|    GE |  7-F |  24% |   +14 |  100.47 |   85.28 |  107.61 |  17.8% |     65 |
|  ZION |  5-L |  24% |   +14 |   71.26 |   62.00 |   75.61 |  14.9% |    107 |
|   LNC |  8-F |  31% |   +14 |   69.64 |   58.06 |   75.08 |  19.9% |     86 |
|   TAP |  4-L |  63% |   +14 |   54.67 |   49.76 |   56.98 |   9.9% |    203 |
|  SIVB |  7-F |  27% |   +14 |  594.52 |  486.73 |  645.18 |  22.1% |      9 |
|   LKQ |  5-L |  51% |   +14 |   47.53 |   43.36 |   49.49 |   9.6% |    239 |
|   MTD |  4-L |  28% |   +14 | 1444.81 | 1309.79 | 1508.27 |  10.3% |      7 |
|    GE |  7-L |  24% |   +14 |  103.74 |   85.28 |  112.42 |  21.6% |     54 |
|   DPZ |  7-F |  24% |   +13 |  415.91 |  378.45 |  433.52 |   9.9% |     26 |
|     K |  1-L |  92% |   +13 |   68.61 |   59.53 |   72.88 |  15.3% |    110 |
|   XRX |  5-L |  33% |   +13 |   21.00 |   18.62 |   22.12 |  12.8% |    420 |
|   SNA |  8-L |  49% |   +13 |  224.45 |  197.74 |  237.00 |  13.5% |     37 |
|    LH |  7-F |  44% |   +13 |  287.25 |  258.70 |  300.67 |  11.0% |     35 |
|   HLT |  8-L |  46% |   +13 |  160.97 |  128.76 |  176.11 |  25.0% |     31 |
|    IT |  8-L |  59% |   +12 |  310.97 |  257.49 |  336.11 |  20.8% |     18 |
|   CAG |  2-L |  53% |   +12 |   39.35 |   30.05 |   43.72 |  30.9% |    107 |
|   SLG |  3-F |  42% |   +12 |   85.04 |   68.33 |   92.89 |  24.5% |     59 |
|    CL |  8-F |  61% |   +12 |   84.56 |   72.19 |   90.37 |  17.1% |     80 |
|   SLB |  1-L |  40% |   +12 |   43.73 |   39.73 |   45.61 |  10.1% |    250 |
|    VZ |  5-L |  34% |   +11 |   61.96 |   49.68 |   67.73 |  24.7% |     81 |
|   BSX |  4-L |  76% |   +11 |   45.33 |   40.79 |   47.46 |  11.1% |    220 |
|   SNA |  7-F |  48% |   +11 |  221.60 |  197.74 |  232.81 |  12.1% |     41 |
|   BDX |  4-L |  87% |   +11 |  278.03 |  214.14 |  308.06 |  29.8% |     15 |
|  FISV |  7-F |  51% |   +11 |  108.91 |   89.90 |  117.84 |  21.1% |     52 |
|   IPG |  8-F |  28% |   +11 |   37.47 |   31.82 |   40.13 |  17.8% |    176 |
|   HCA |  6-L |  54% |   +11 |  272.27 |  241.89 |  286.55 |  12.6% |     32 |
|    ES |  4-L |  76% |   +11 |   96.67 |   76.63 |  106.09 |  26.2% |     49 |
|  CHRW |  2-L |  63% |   +10 |  112.16 |   86.56 |  124.19 |  29.6% |     39 |
|   DFS |  5-L |  39% |   +10 |  117.07 |  107.34 |  121.64 |   9.1% |    102 |
|   SLG |  3-L |  42% |   +10 |   85.19 |   68.33 |   93.11 |  24.7% |     59 |
|  FISV |  7-L |  51% |   +10 |  111.00 |   89.90 |  120.92 |  23.5% |     47 |
|    WU |  5-L |  57% |   +10 |   20.41 |   17.17 |   21.93 |  18.9% |    308 |
|   SNA |  8-F |  49% |   +10 |  218.55 |  197.74 |  228.33 |  10.5% |     48 |
|   WFC |  1-L |  36% |   +10 |   54.21 |   46.57 |   57.80 |  16.4% |    130 |
|  BF-B |  8-L |  76% |   +10 |   70.33 |   62.32 |   74.09 |  12.9% |    124 |
|   BLL |  6-L |  28% |   +10 |   98.00 |   84.14 |  104.51 |  16.5% |     72 |